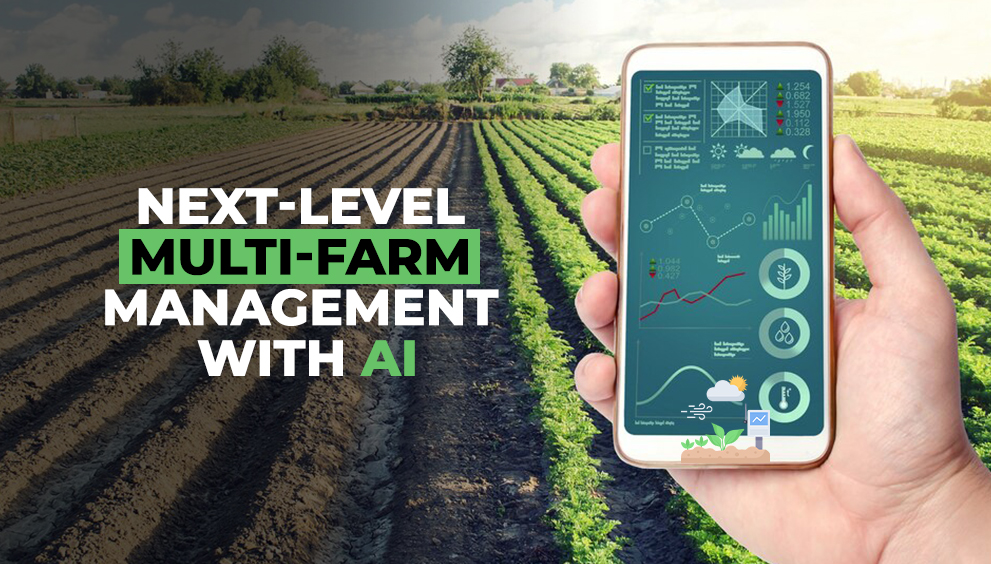


How can you monitor hundreds of farms from one screen?

Smart monitoring at scale starts with a smarter screen.
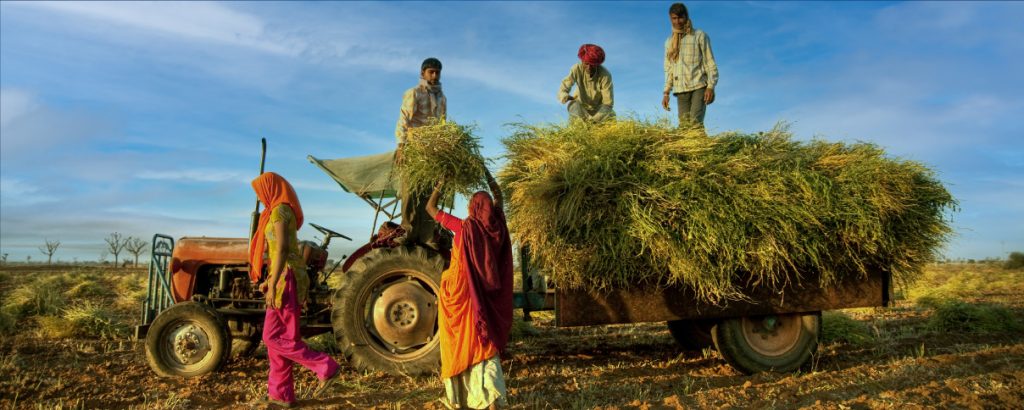
As agriculture becomes more data-driven and decentralized, the challenge is no longer just growing crops — it’s managing scale efficiently. Agribusinesses, cooperatives, government programs, and sustainability initiatives often work with hundreds or even thousands of farms spread across states, districts, or even countries. In such contexts, the question becomes vital:
How do you monitor all these farms — in real time — from one screen?
The answer lies in a powerful combination of satellite monitoring, GIS (Geographic Information System), AI-based analytics, and centralized farm dashboards. Let’s break down the core technologies and strategies that enable organizations to monitor vast agricultural networks — without the cost or complexity of frequent field visits.
🌍 The Challenge of Scale in Farm Monitoring
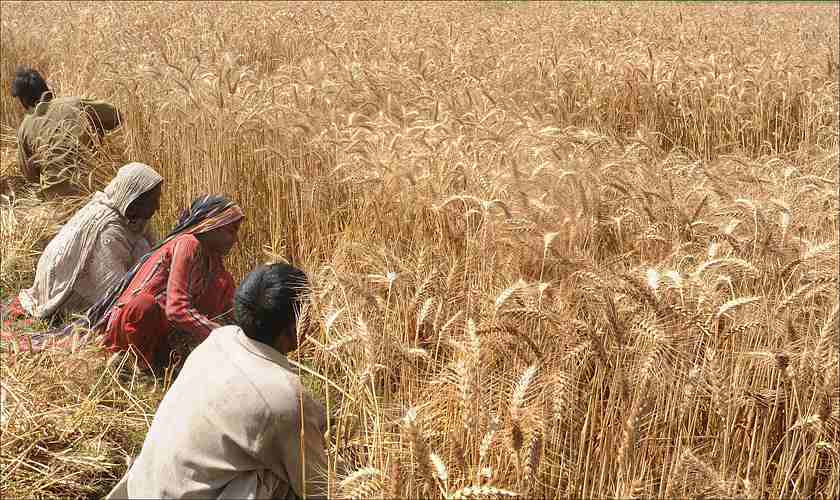
Monitoring just one farm manually is manageable. But once you’re tracking hundreds of farms — often with different crops, planting dates, soil types, and farmer practices — the traditional model of field scouting collapses. It becomes:
- Too slow for timely decision-making
- Too expensive for routine coverage
- Too inconsistent for performance comparison
This is where centralized, screen-based monitoring systems powered by geospatial data come in.
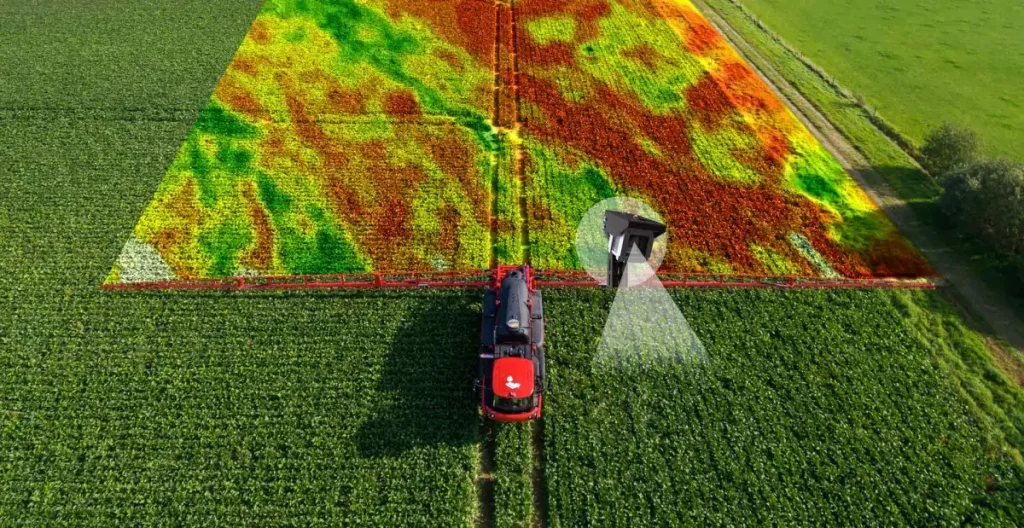
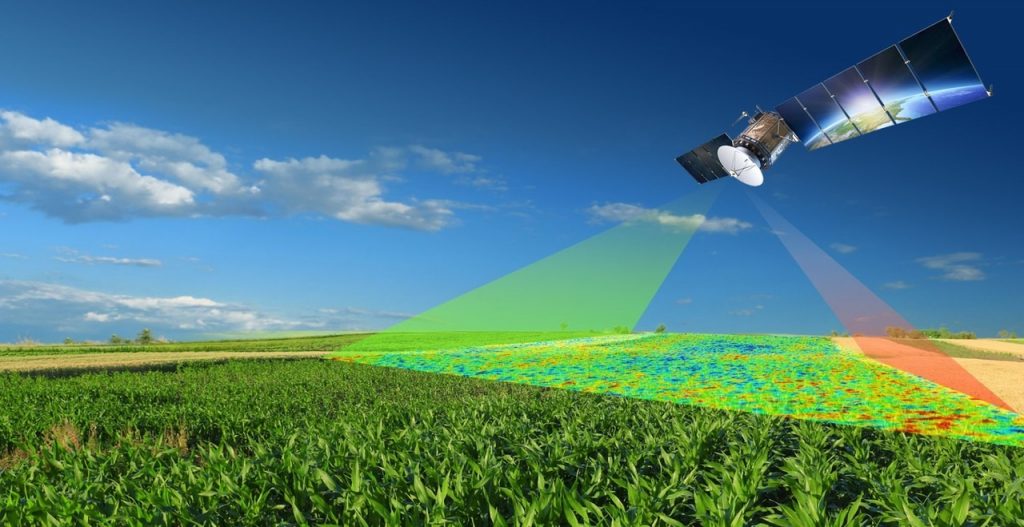
🛰️ Satellite Imagery: A Scalable Foundation
The first building block of large-scale farm monitoring is satellite data. Public missions like Sentinel-2 (ESA) and Landsat (NASA/USGS) provide free, high-resolution imagery at regular intervals (as frequent as every 5 days).
By analyzing this data using vegetation indices such as:
- NDVI (Normalized Difference Vegetation Index)
- NDRE (Normalized Difference Red Edge)
- SAVI (Soil Adjusted Vegetation Index)
…you can remotely assess crop health, vigor, and growth trends for every farm on your list — no matter how geographically dispersed they are.
🗺️ GIS + AI = Smart, Layered Monitoring
Satellite data alone isn’t enough. To make it actionable, you need GIS software platforms that layer different kinds of farm data — spatial, agronomic, and temporal — into a unified dashboard.
These platforms allow you to:
- Map individual farm boundaries across districts or states
- Assign identifiers for each farm, farmer, or contract plot
- Overlay satellite-derived crop health, weather, and soil data
- Track field-specific performance across time
- Aggregate health scores to identify trends or underperformers
Advanced platforms like SrajanAI also use AI to predict yield, detect anomalies, and classify risks, helping teams focus on where it matters most.
📊 Dashboards: Your One-Screen Command Center
With the right dashboard, you’re no longer switching between files, folders, and reports. Instead, you get:
- A live map of all farms with real-time status
- Color-coded health indicators (e.g., green = healthy, red = stressed)
- Filters for region, crop type, season, and risk level
- Farm-wise comparisons of performance over time
- Auto-generated reports that can be downloaded or shared instantly
This screen becomes your operational nerve center — helping agronomists, managers, and even field teams make smarter, faster decisions.
🔔 Real-Time Alerts & Prioritization
One of the biggest advantages of monitoring from one screen is that you can set alerts and thresholds that automatically notify your team when something goes wrong.
For example:
- If NDVI drops below a set level, the farm is flagged for potential drought or pest stress
- If no change is observed over time, it may indicate sowing delays or crop failure
- If a particular region shows consistently low health scores, it can be prioritized for field visits or intervention
This allows teams to prioritize their efforts, rather than reacting too late or spreading themselves thin.
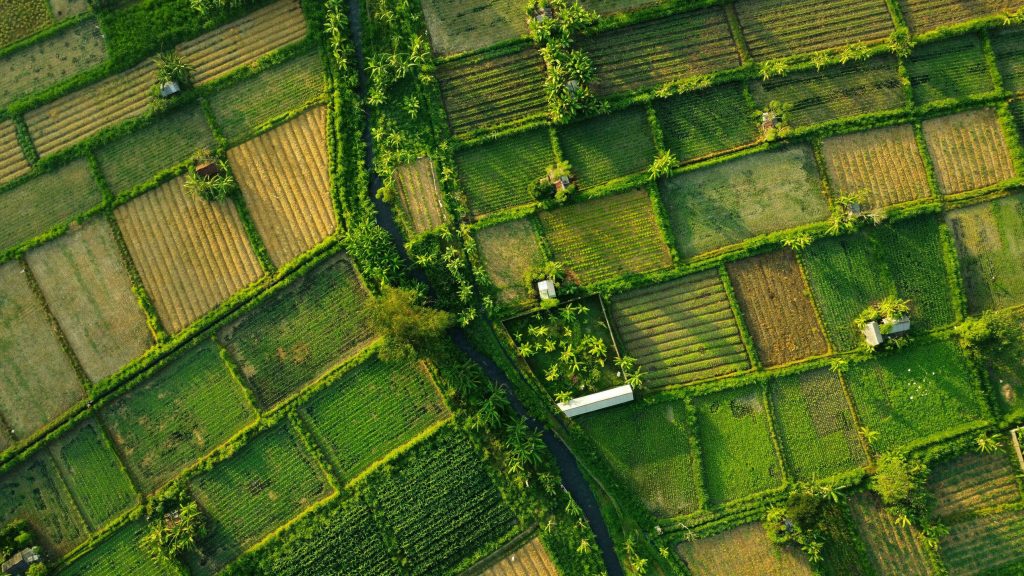
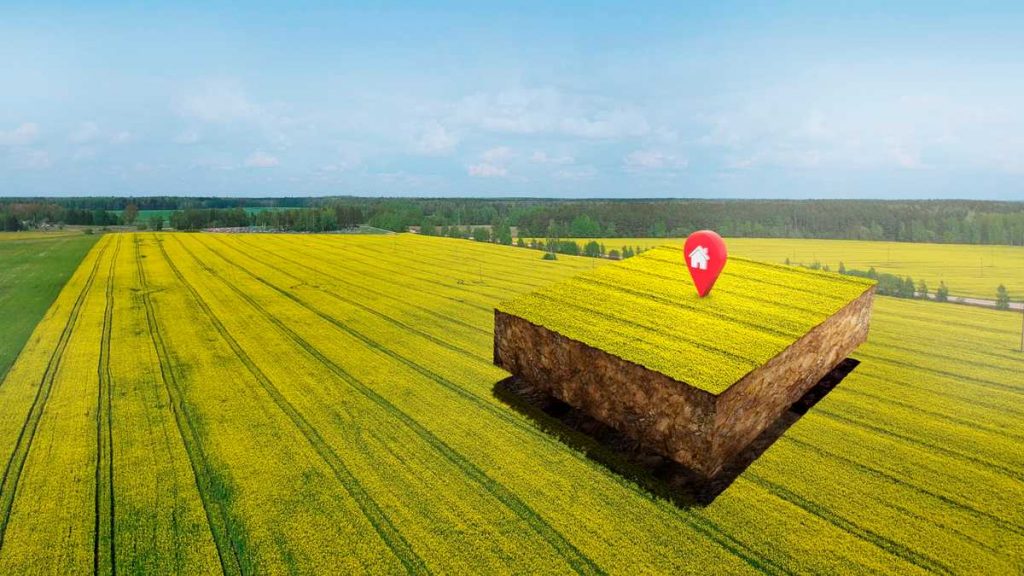
📍 Farm Boundary Identification at Scale
How do you even define farm plots when you have hundreds or thousands? Platforms like SrajanAI offer automated farm boundary detection using AI and satellite inputs. With just one GPS point, the system can:
- Suggest an accurate field boundary
- Calculate the area
- Register it under a unique farm ID
This makes onboarding new farms lightning-fast and ensures consistency across your monitoring ecosystem.
💼 Who Needs Multi-Farm Monitoring?
This kind of one-screen farm monitoring is essential for:
- Agri-corporates sourcing raw materials from contract farmers
- Government schemes disbursing subsidies or running productivity programs
- NGOs and donor projects tracking field impact and adoption
- FPOs and cooperatives managing decentralized farmer networks
- Food processors/exporters ensuring traceability and quality consistency
✅ Real Benefits of Monitoring from One Screen
- Save Time and Field Costs
No more unnecessary farm visits — go only where attention is needed. - Standardize Monitoring
Apply the same logic to all farms — regardless of geography or team. - Improve Decision-Making
Spot trends early, prevent losses, and plan interventions more effectively. - Enable Remote Collaboration
Managers in the city, agronomists in the field, and partners abroad can all access the same data — in real time. - Track Program Impact Over Time
Generate historical comparisons, impact reports, and visual timelines for each farm or region.
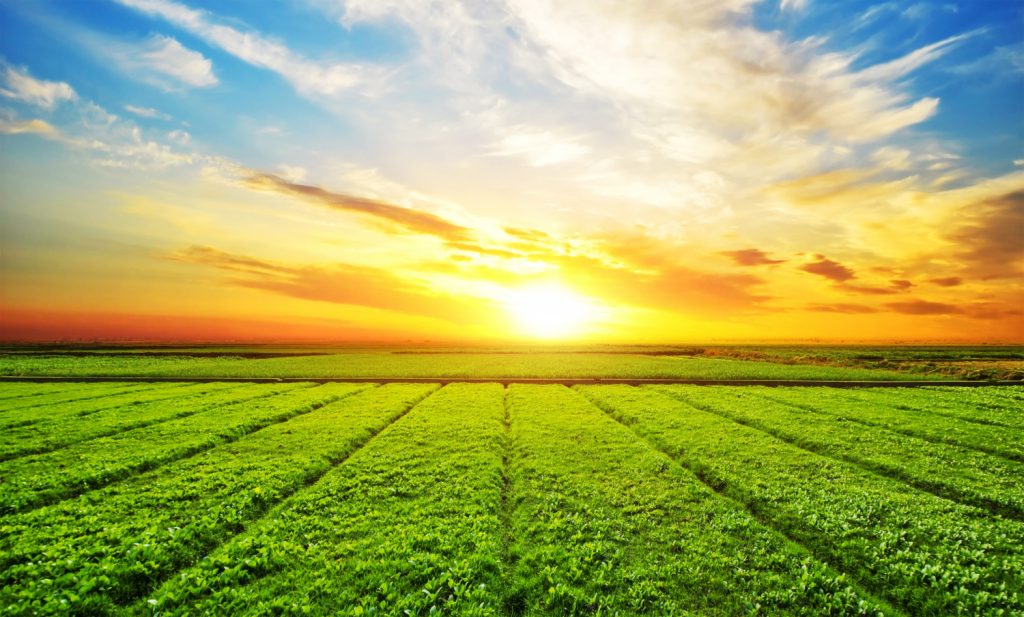
🌿 Conclusion: Scale Without Complexity
Monitoring hundreds of farms doesn’t have to mean hiring hundreds of scouts or collecting thousands of spreadsheets. With the right combination of satellite data, geospatial analytics, and centralized dashboards, you can monitor every farm — every week — from one screen.
Whether you’re ensuring productivity, driving sustainability, or delivering impact, smart monitoring at scale starts with a smarter screen.