


Health indicators for Better Farms
What to Track and Why It Matters
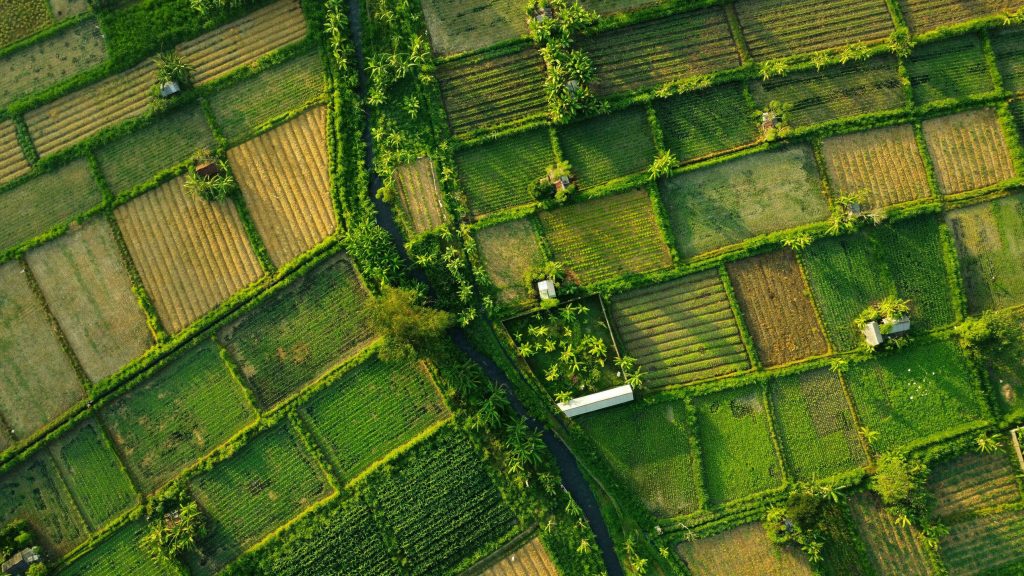
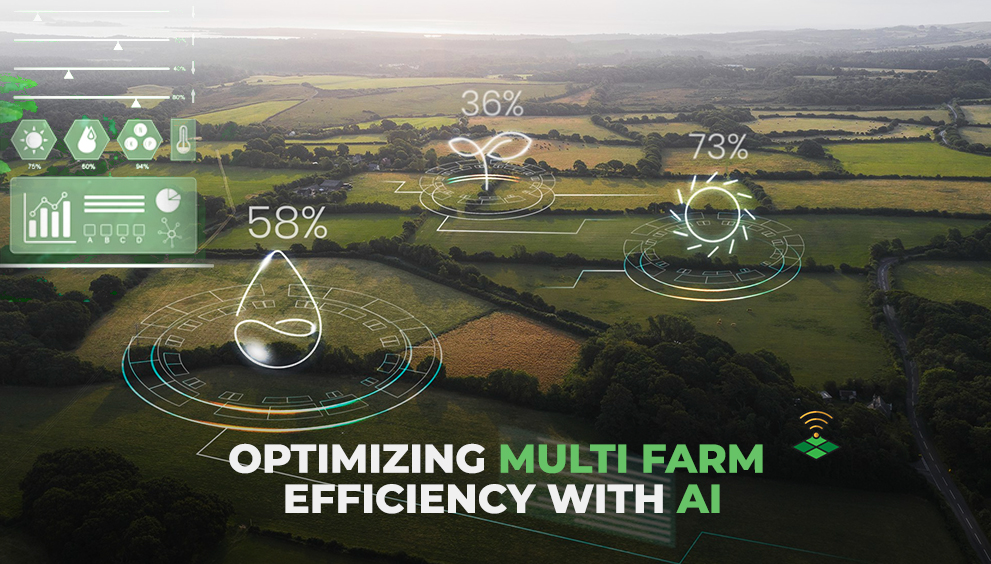
As agriculture evolves into a more data-driven industry, simply growing crops is no longer enough. The key to sustainable productivity and long-term resilience lies in monitoring and improving farm health — consistently and at scale.
But what does “farm health” really mean? And which indicators should you monitor to ensure that your land, crops, and systems are performing at their best?
This blog explores the concept of farm health indicators, why they matter, and how modern monitoring tools help track them across hundreds of farms — all from one platform.
🌾 What Are Farm Health Indicators?
Farm health indicators are measurable variables that reflect the condition and productivity potential of your farm at any given time. They cover three core areas:
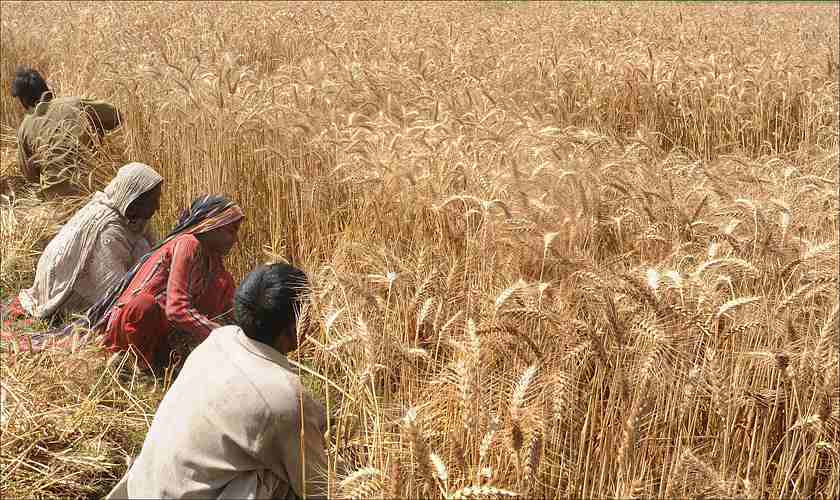
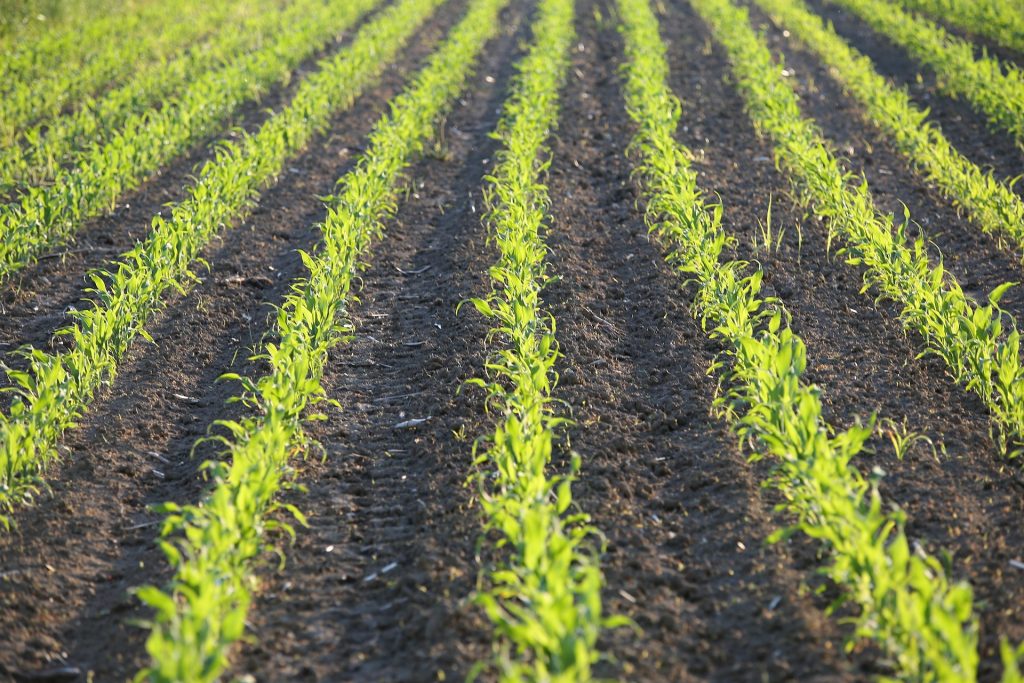
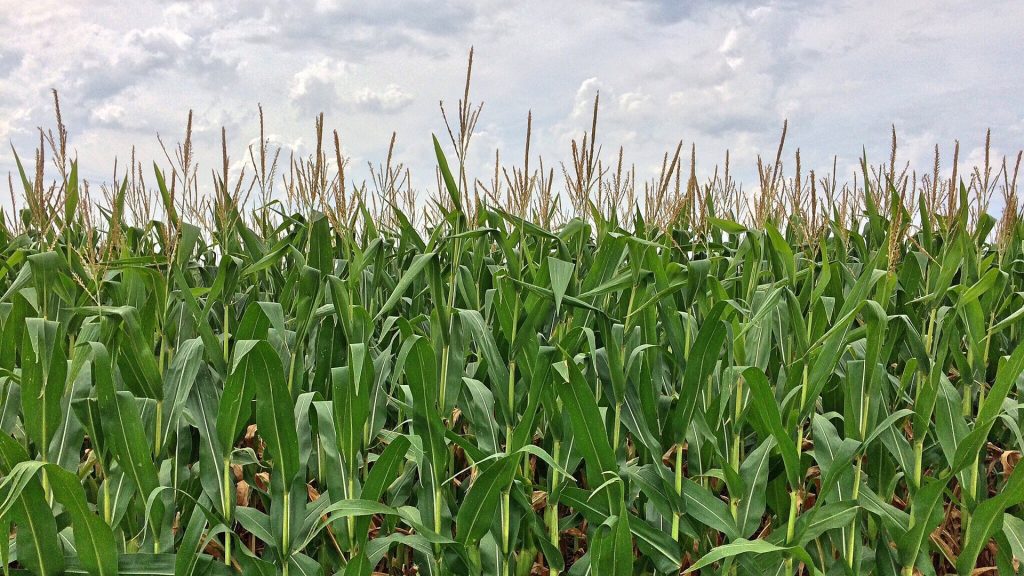
- Crop Health – How well your crops are growing
- Soil Health – The long-term quality of the land
- Environmental Conditions – External factors like water, weather, and stress
By combining these indicators, you get a complete picture of what’s happening in the field — and what needs to change to improve performance.
🧪 Key Health Indicators Every Farm Should Track
Let’s explore the most important farm health indicators that organizations and agribusinesses use to make better decisions.
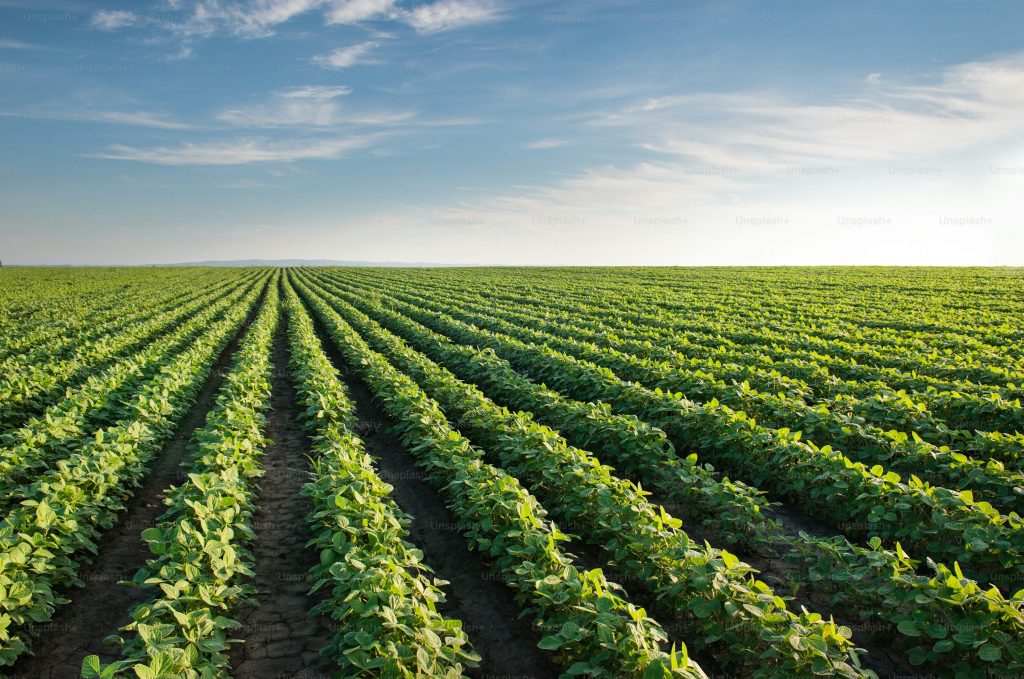
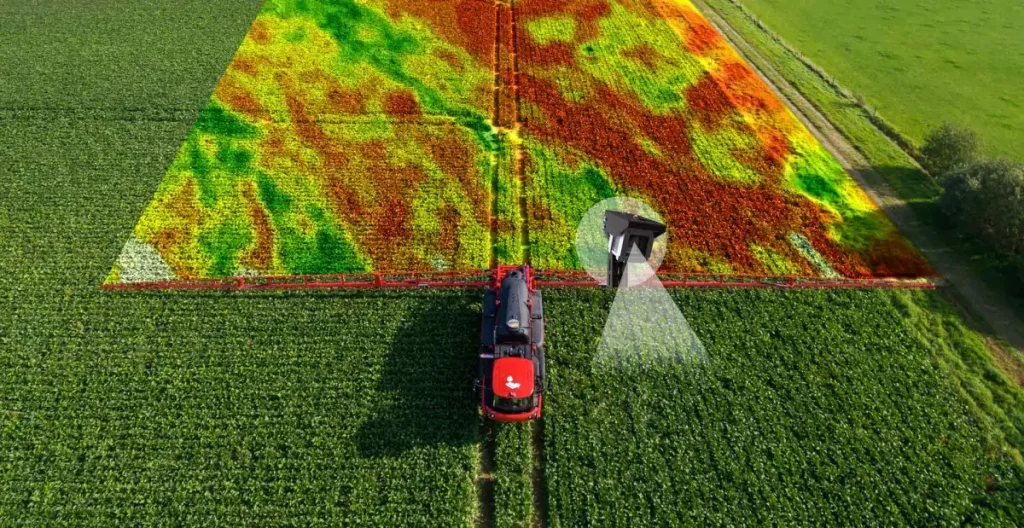
1. 🌿 Vegetation Indices (e.g., NDVI, NDRE)
Why it matters: Vegetation indices derived from satellite imagery help assess the greenness and vigor of crops.
- NDVI (Normalized Difference Vegetation Index) is widely used to detect stress, disease, or poor growth early.
- NDRE is especially useful during later crop stages when NDVI saturates.
How to use it: Monitor weekly trends. A sudden drop may indicate pest stress, nutrient deficiency, or water issues.
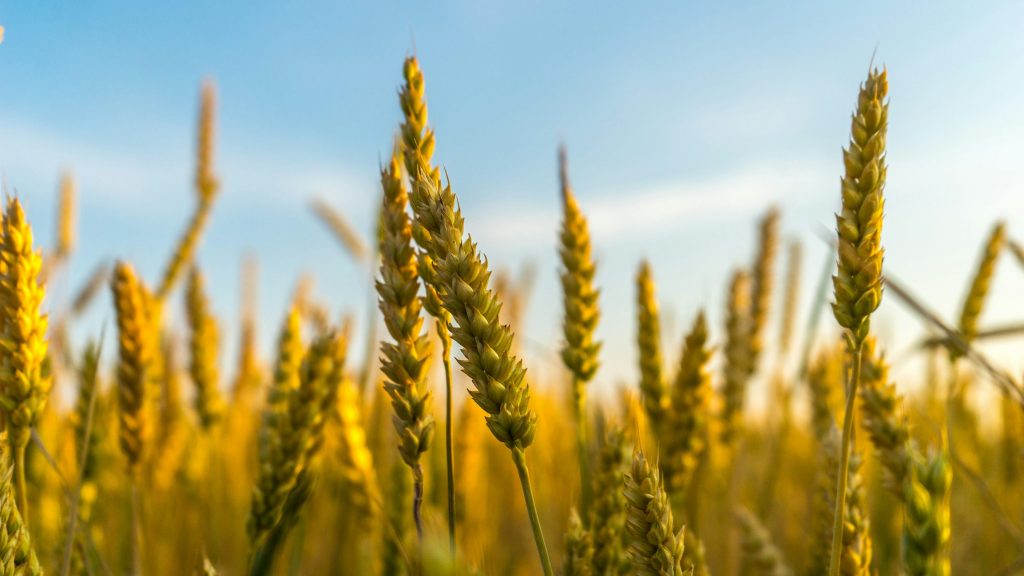
2. 🌾 Crop Health Score
Why it matters: A simplified score (often on a scale of 1–5 or 1–100) summarizes the overall crop condition using a combination of vegetation index, growth stage, and environmental context.
How to use it: Use crop health scores to compare performance across farms, prioritize field visits, or track improvement over time.
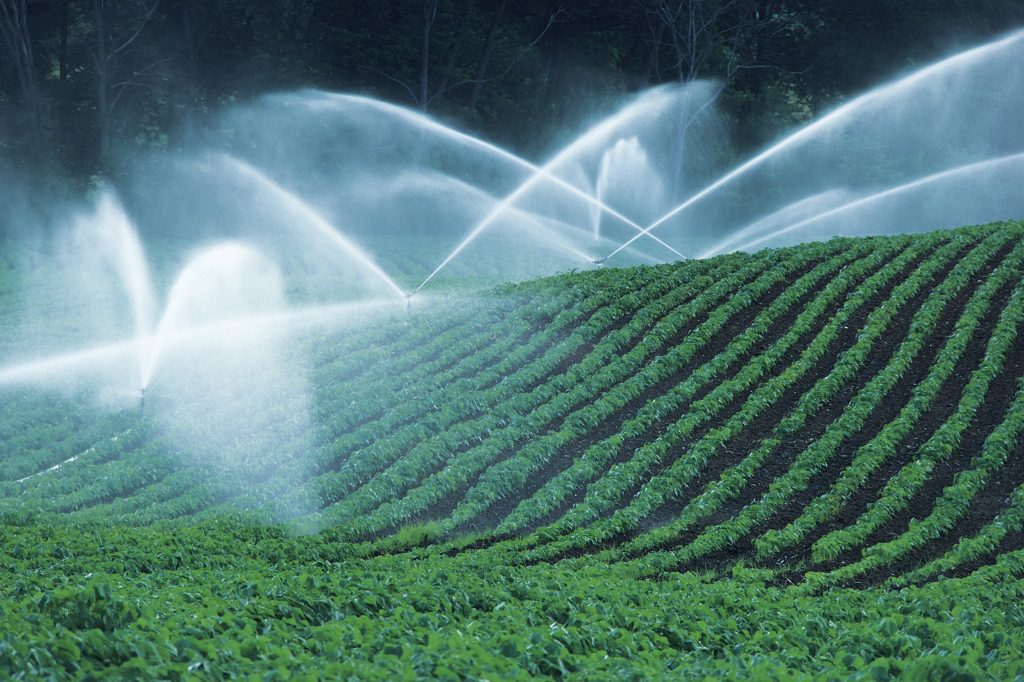
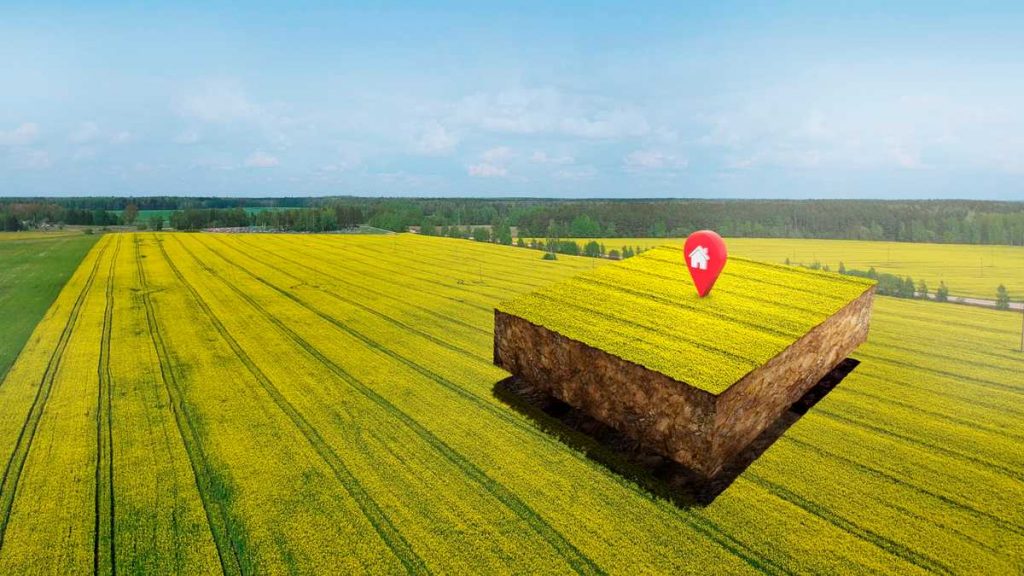
3. 🌱 Soil Moisture Levels
Why it matters: Soil moisture affects germination, nutrient uptake, and crop yield. Both excess and deficiency can lead to reduced output or plant stress.
How to use it: Use remote sensing or IoT sensors to measure soil moisture and adjust irrigation or drought planning accordingly.
4. 🧬 Soil Organic Carbon and Nutrient Balance
Why it matters: Healthy soil contains the right balance of nitrogen (N), phosphorus (P), potassium (K), and organic matter. Over-farming or poor practices can deplete this balance.
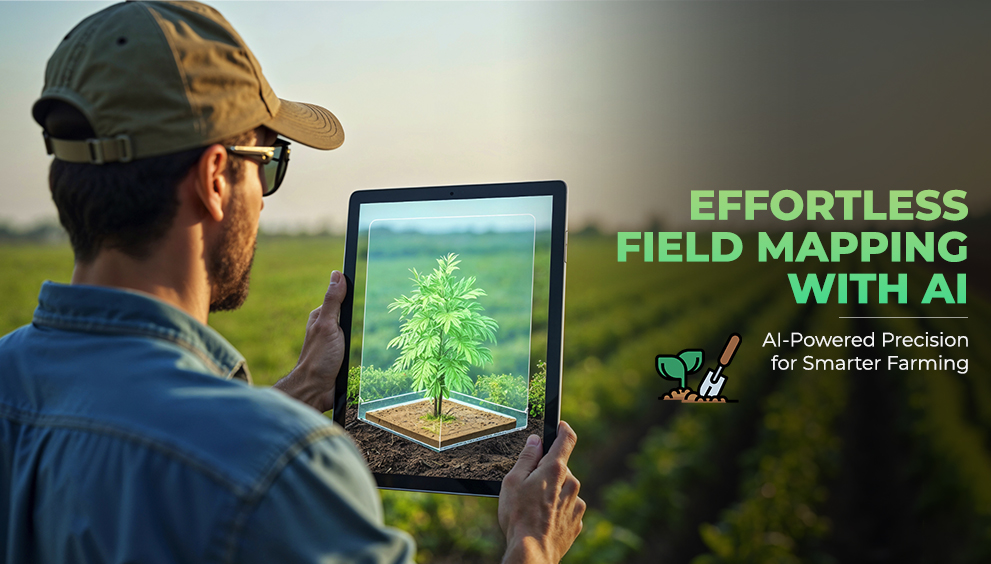
How to use it: Conduct soil tests periodically and track changes. Use digital maps to visualize nutrient zones for variable fertilizer application.
5. 🌤️ Temperature and Rainfall Patterns
Why it matters: Crop development is closely tied to climate. Tracking weather indicators helps in understanding stress patterns and planning for future risks.
How to use it: Monitor cumulative rainfall, temperature trends, and heat stress indicators during each crop phase.
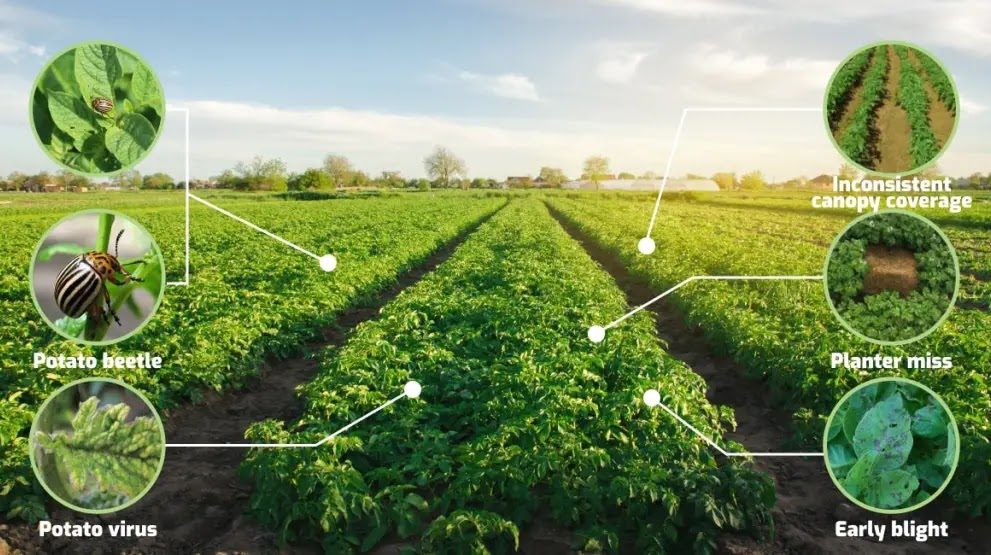
6. 🦠 Pest and Disease Incidence
Why it matters: Even small outbreaks can quickly damage yields across multiple farms. Early detection is crucial.
How to use it: Monitor hotspots using NDVI drop patterns, field reports, or AI-based pest risk alerts from satellite data.
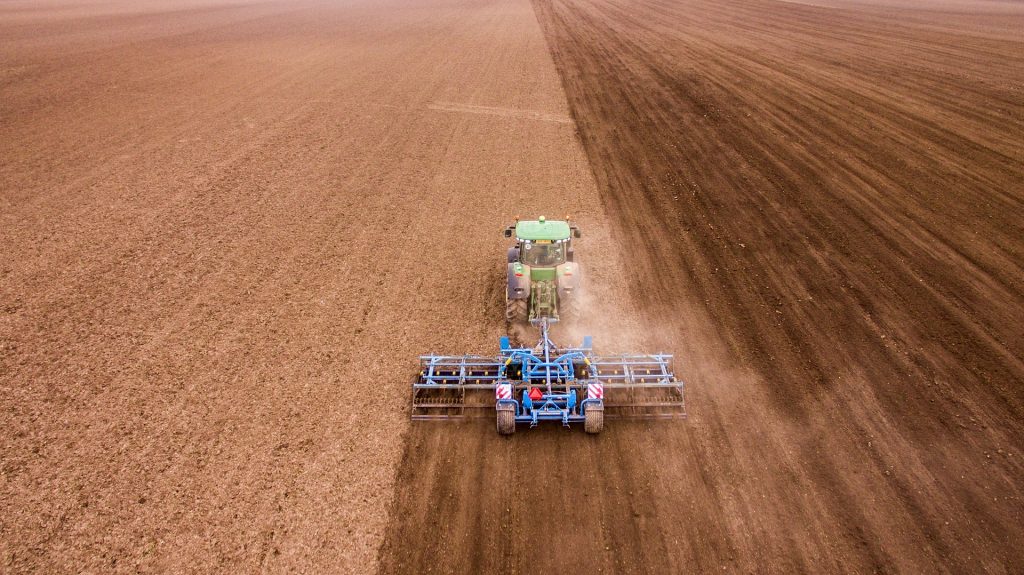
7. 🚜 Input Efficiency
Why it matters: Excessive or poorly timed use of fertilizer, pesticide, or irrigation reduces productivity and increases costs.
How to use it: Track input use per acre and compare it to crop health results. Low efficiency = wasted inputs or poor practices.
8. 📈 Yield Trends and Forecasts
Why it matters: Yield is the final indicator of whether your farm health strategy is working. Monitoring historical vs forecasted yield helps you evaluate success.
How to use it: Use satellite-based tools combined with crop models to estimate yield before harvest and plan logistics better.
🧭 Why Tracking Farm Health Indicators Matters
Tracking these indicators regularly brings tangible benefits:
- Early detection of problems – Act on signs of stress before it’s visible to the naked eye
- Efficient use of resources – Apply water and nutrients where needed, not uniformly
- Standardized monitoring across farms – Especially useful in contract farming and sourcing programs
- Better decision-making – Whether it’s field planning, input procurement, or harvest scheduling
- Higher profitability – By reducing input waste, avoiding loss, and improving output
- Sustainability – Healthier soil and optimized inputs reduce environmental impact
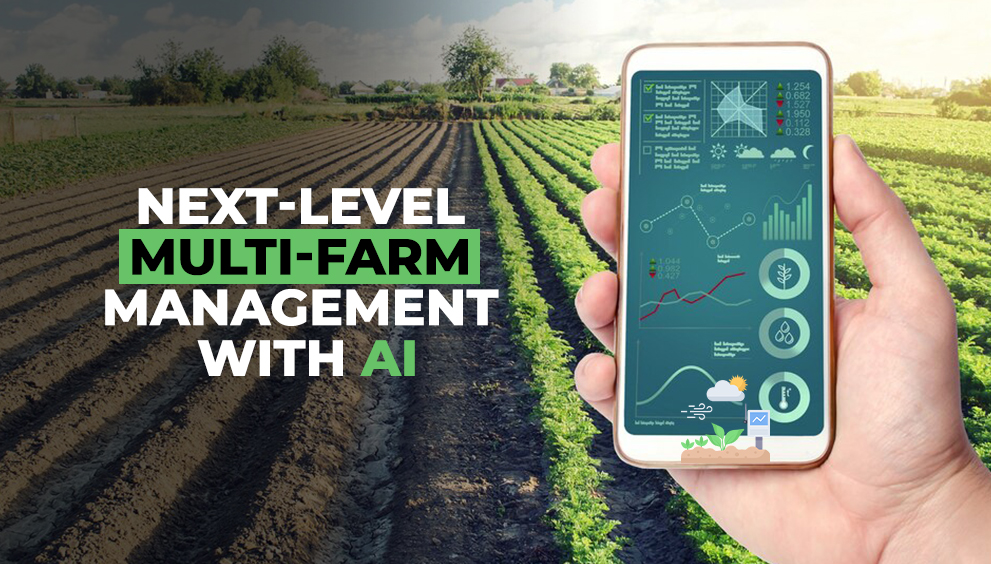
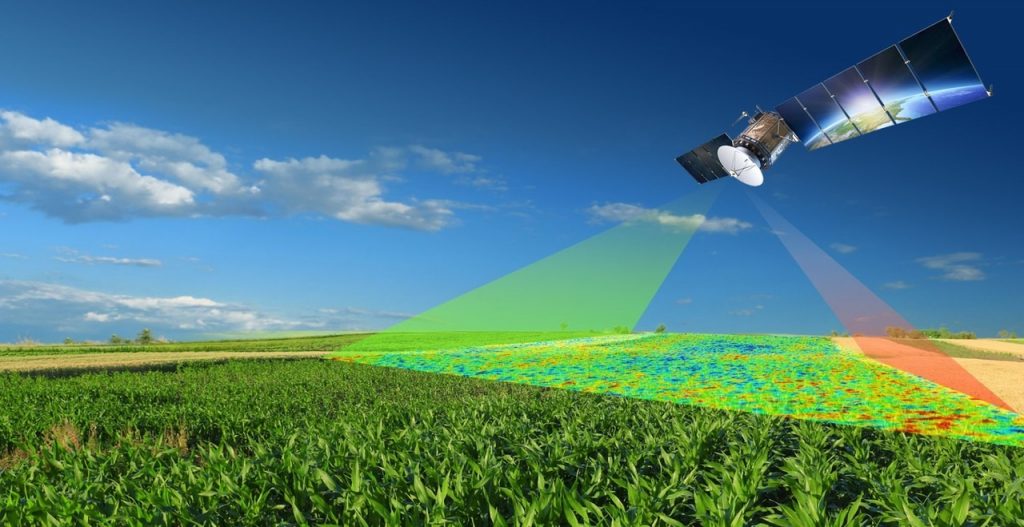
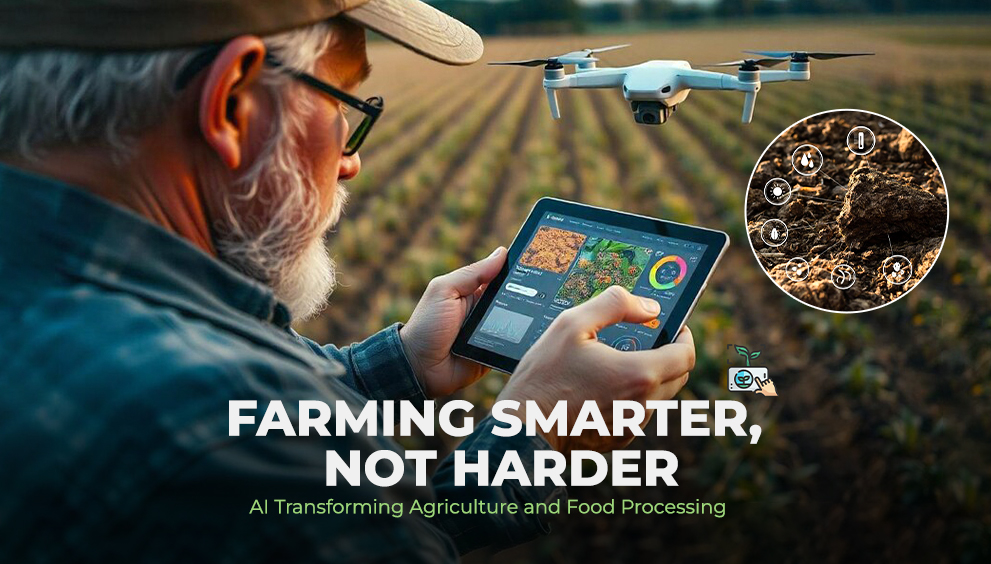
🛰️ How to Monitor These Indicators at Scale
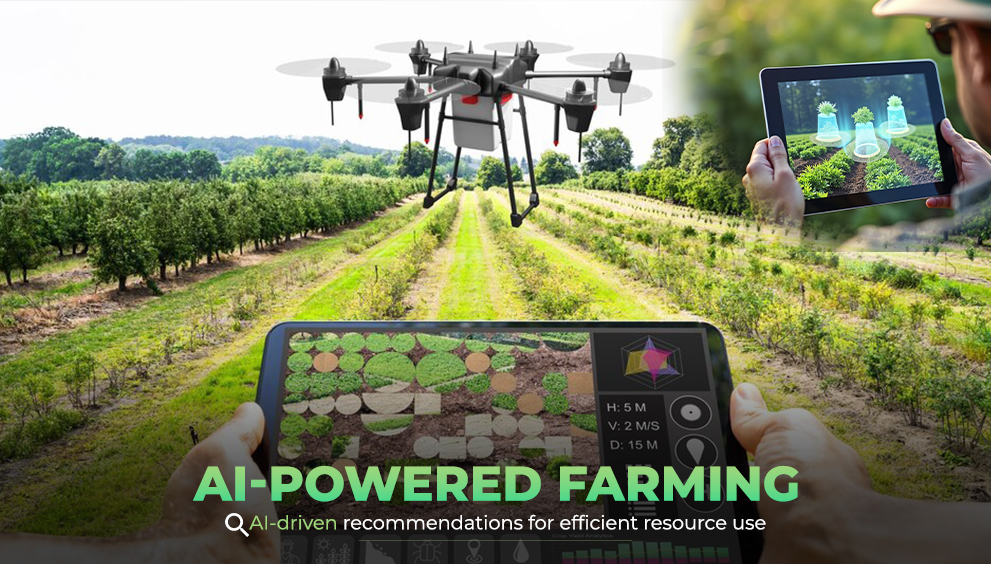
Manually checking these indicators on hundreds of farms is impractical. That’s why modern agri-monitoring platforms like SrajanAI integrate:
- Satellite imagery and GIS layers
- Crop-stage-based scoring systems
- Real-time dashboards and alerts
- Historical data comparisons
- Weather + pest forecasting models
This means agribusinesses, NGOs, and farmer producer companies can view all key indicators from one centralized screen, and even filter by region, crop, or health level.
🌿 Final Thoughts: Better Indicators, Smarter Farming
Healthier farms don’t happen by chance. They happen through constant measurement, interpretation, and action. By using smart farm health indicators — and tools to monitor them at scale — agricultural enterprises can become more resilient, more productive, and more sustainable.
Whether you’re managing 10 farms or 10,000, it all starts with asking: What are your farm health indicators telling you today?